
LabMaps
Geographic intelligence for medical laboratories: map laboratories, healthcare providers and population to make informed location and development decisions.
Mapping
Laboratories
Population
INSEE data
Catchment
Areas of influence
Healthcare
Statistics
Key Features
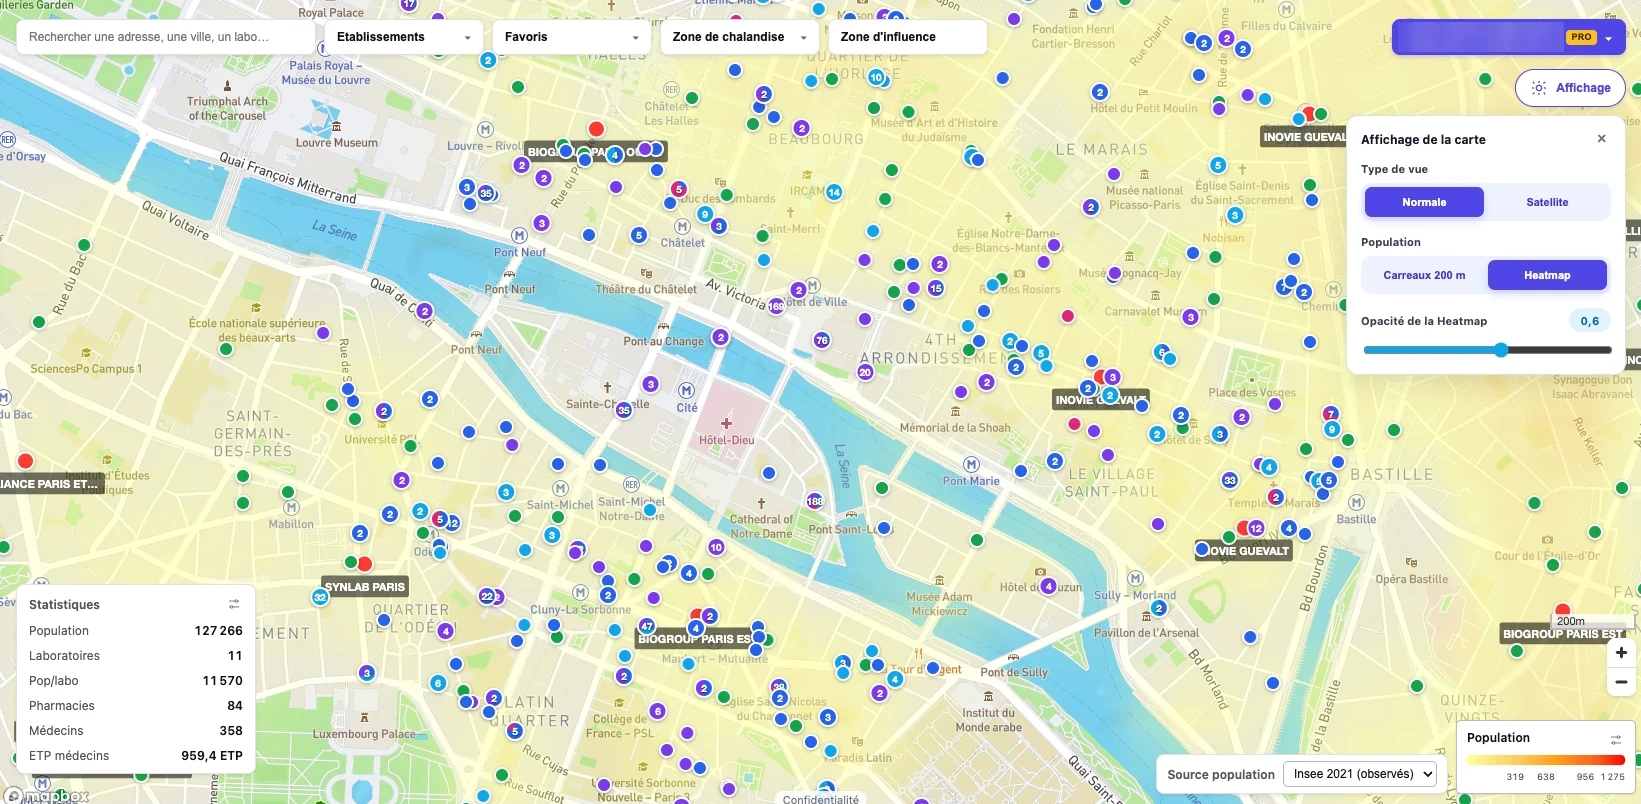
Visualize laboratories, sampling sites, groups and healthcare facilities on a single interactive map, in standard or satellite view.
Interactive Map
Every laboratory at a glance
Display population density as a heatmap or 200 m grid squares based on official INSEE data to spot under-served areas.
Population Heatmap
INSEE data, 200 m grid
Draw catchment and influence areas around any site to estimate the population and competition it serves.
Catchment Areas
Trade & influence zones
Get instant figures for any area: population, laboratories, population per laboratory, pharmacies, physicians and physician FTEs.
Area Statistics
Key indicators instantly
Search by address, city or laboratory, filter by facility type and save your favorite sites for quick access.
Search & Favorites
Find and follow sites
Support site openings, acquisitions, network reorganization and sampling strategy with objective geographic data.
Decision Support
Location & development
Discover LabMaps
Want to see LabMaps on your territory? Contact us for a demo and access to the platform.
Stay Informed
Follow ISONEVA for insights on quality, engineering and innovation in healthcare.
Call Us
+33 (0) 1 84 20 26 09
Email Us
contact@isoneva.com